Trader Spotlight – Bin Lu Recovers from 23% Drawdown Trading US Indices
The US indices have provided traders with more opportunity than usual, as the Dow Jones index rockets 13.8% in the last eleven trading days.
We saw the results Geoff Rider had last week on trading the Dow Jones here, with a 94% hit rate, and today, we are taking a look at this week’s leader, Bin Lu.
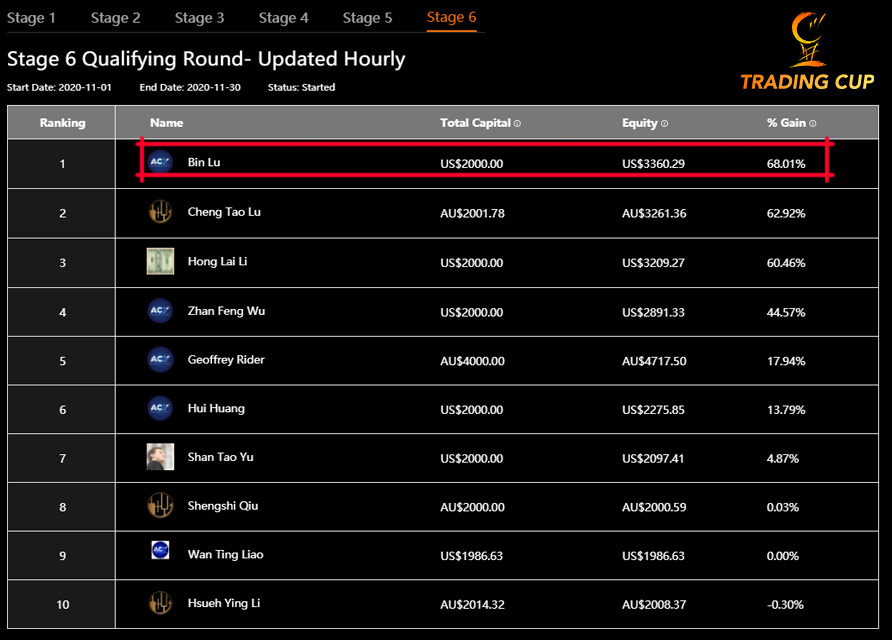
As you can see below, Bin Lu is sitting at 68% return after just 16 days into November. An incredible effort in anyone’s book.
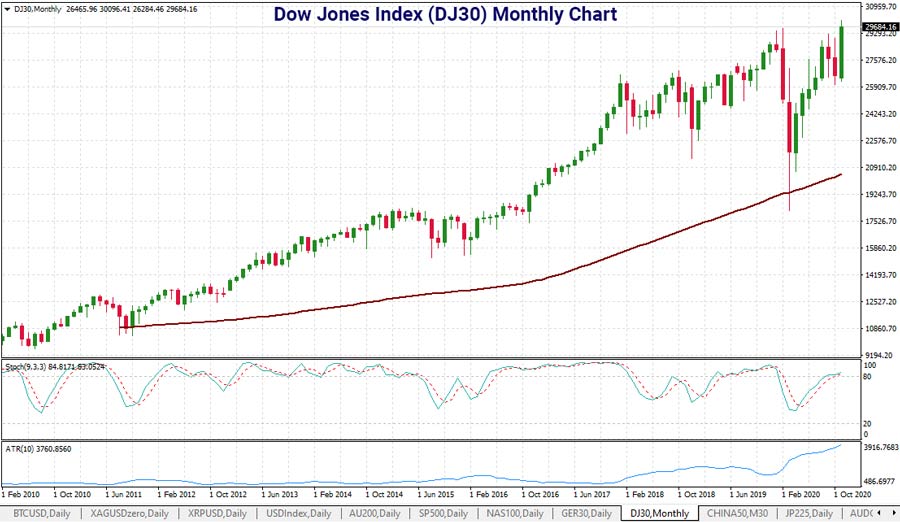
If we take a look at the Dow Jones index, which is Bin’s most actively traded instrument, you can see how strong the recent move has been since 2010, recently hitting record highs.
Dow Jones (DJ30) index CFD
When we look at the daily chart, you can see how explosive the move has been, with the index rising 13.8% since the lows on the 30th of October.
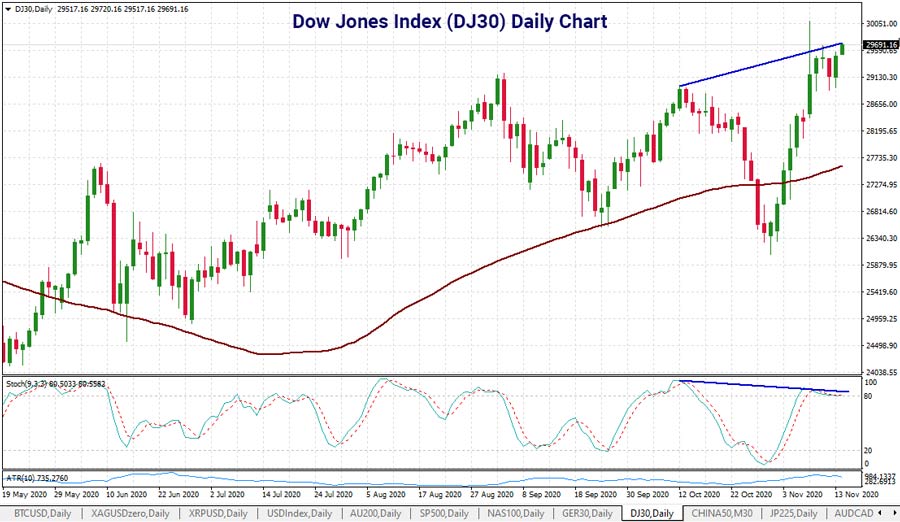
What is interesting to note is the bearish divergence that is starting to show.
Bearish divergence is where you have the underlying instrument making higher highs, but the oscillator, in this case, the stochastics, hits lower highs. Therefore, it is said to be diverging and is often noted as one of the most powerful signals in the market.
You need to consider the momentum of the market you are trading and understand that bullish and bearish signals are reversal signals, which are more for advanced traders.
A recent Bloomberg article highlights what Joe Biden calls a dark winter ahead for Wall Street, suggesting the economic damage will continue to be painful.

In a TV interview in that article, Margaret Anadu is quoted as saying: “A full 40% of small businesses do not think they’re going to survive, and that’s the highest number we’ve seen since April.”
Which makes the current market moves even more interesting. Despite this gloomy economic backdrop, the US and global indices are climbing higher, along with real estate (in some places).
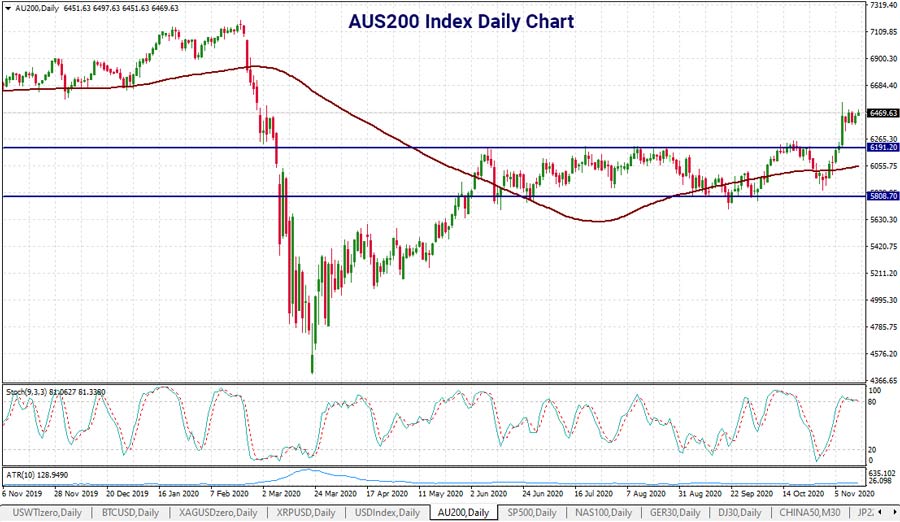
Even our local Aussie 200 index has broken out of a recent range.
Trader spotlight with Bin Lu who mainly trades the Dow Jones index
Today we will take a look over the trading style and statistics of Bin Lu, who is sitting atop the Stage 6 Trading Cup leaderboard.
Since the start of November, Bin’s completed 171 trades, with 121 of them on the DJ30 index CFD.
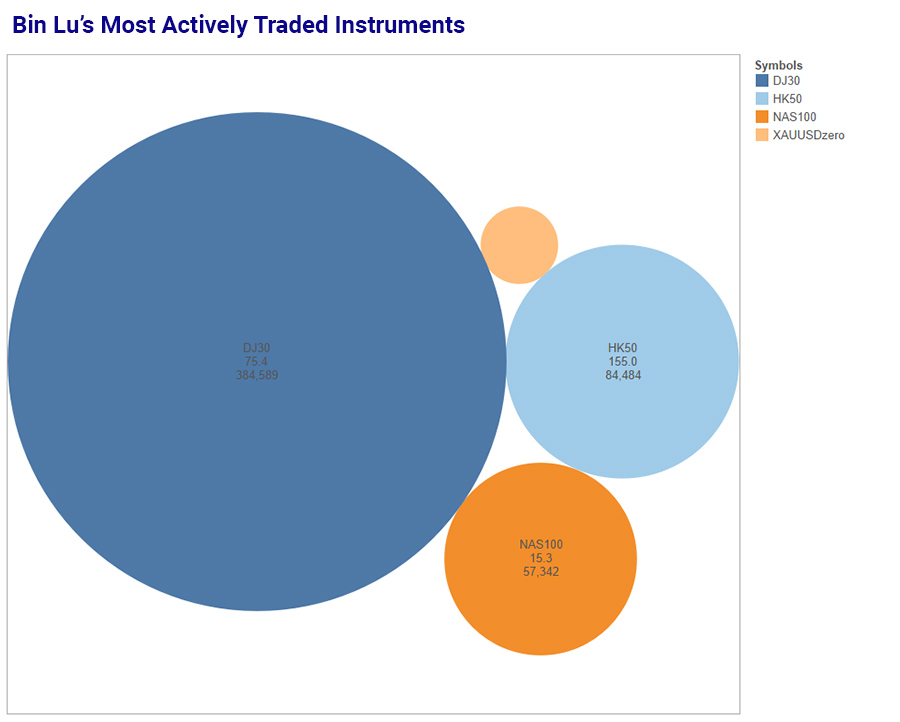
Despite the Dow Jones going up, 39% of his trades have been to buy, with 61% of his trades on the DJ30 index to sell.
Equity curve, drawdown and percentage win and loss
Bin Lu is a consistent performer with steady wins and steady losses.
As you can see from his equity curve below, there has only been one larger than normal drawdown period, which saw him lose 23% of his equity.
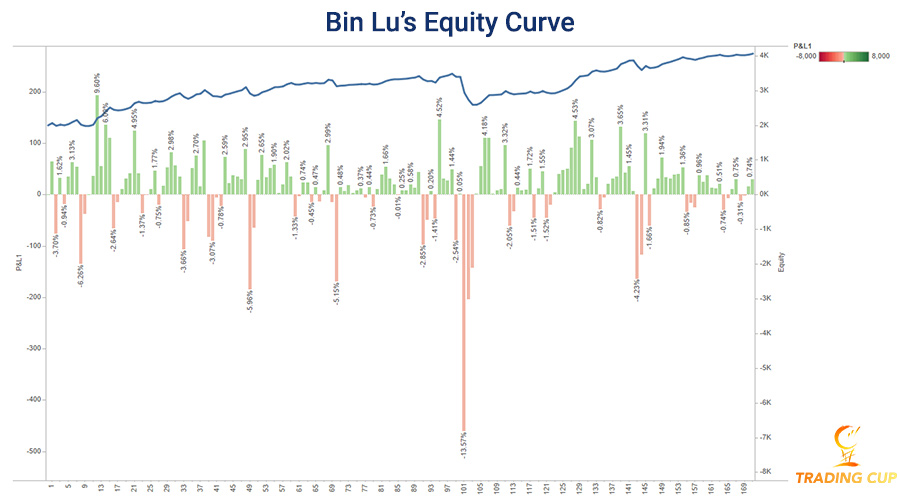
Bin Lu’s biggest losses occurred while short-selling the DJ30 index CFD.
This resulted in total losses of $807.61.
But as you can see from the equity curve above, she bounced back strongly, needing only 26 trades to surpass the previous equity high.
From there, another 26 trades have resulted in adding another 19% to the bottom-line results.
Trading statistics of Bin’s system
Bin Lu has been winning on 70% of her trades, steadily trading her edge.
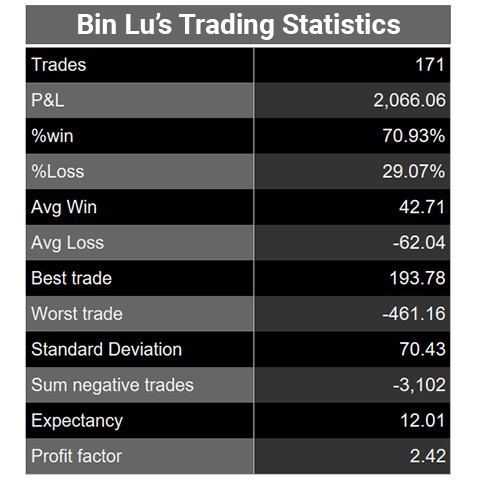
When Bin wins, she wins around $42, and her losses have been averaging $62. But you can see the massive $461.16 loss influences the average loss. In relative terms, that was an enormous hit on her account.
We’ve not seen Bin Lu on the leaderboard in previous months, so it is great to see her leading the charge in November.
A tight leaderboard at the top
November is shaping up to be a close battle, with our top three within 8% of each other.
It just goes to show how challenging November has been.
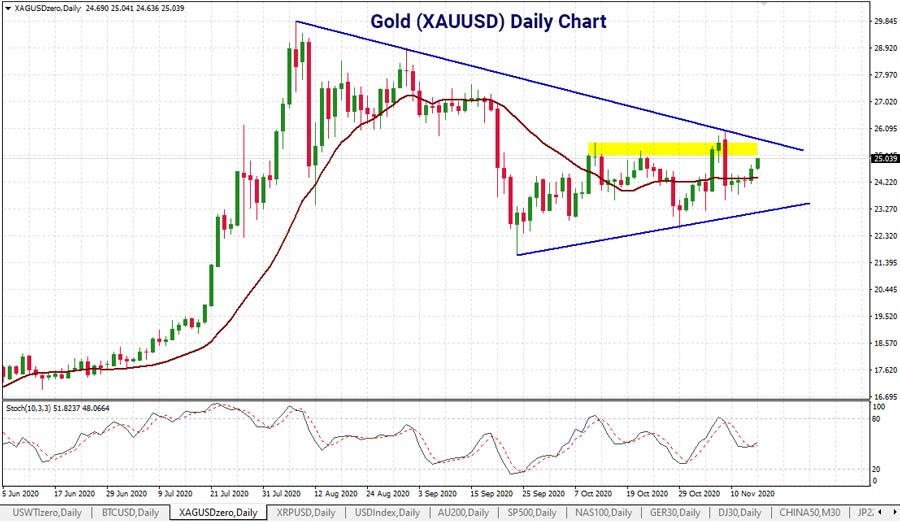
One of the reasons has been markets that appear to be trending in one direction have snapped back rather quickly.
Gold is a great example, with the precious metal breaking out strongly on the 5th and 6th of this month, only to pull back dramatically on Monday the 9th, as noted on the chart below.
Hopefully, you are getting inspired by the results of traders like Bin Lu, Hong Lai Li, Dulian Liu, Yi Yun Zheng, Cheng Tao Lu, and James Hu, to name a few.
Remember, you are running out of time to qualify for the Grand Final of the 2020 Trading Cup. Click the links below to get started.
We wish you every success with your trading in Stage 6 and beyond.
Are you ready to join the next Stage? Click here to register an account.

Ashley Jessen is the author of CFDs Made Simple and Chief Operating Officer at ACY Securities. He has been in the financial services industry since the year 2000 and worked for some of the leading companies in the CFD, Forex and Online Trading space.

