Revealed: Top 3 Traders for October and Their Trading Statistics
With the end of the month so close, I thought it would be good to review the equity curve of the top three traders, their trading statistics, and how they have progressed during the month.
US Indices had a mixed session with many of the tech giants reporting. As a result, we saw a big run-up on the Nasdaq, which closed 1.64% higher.
But that doesn’t tell the full story, as the likes of Apple, Facebook, and Google reported after hours.
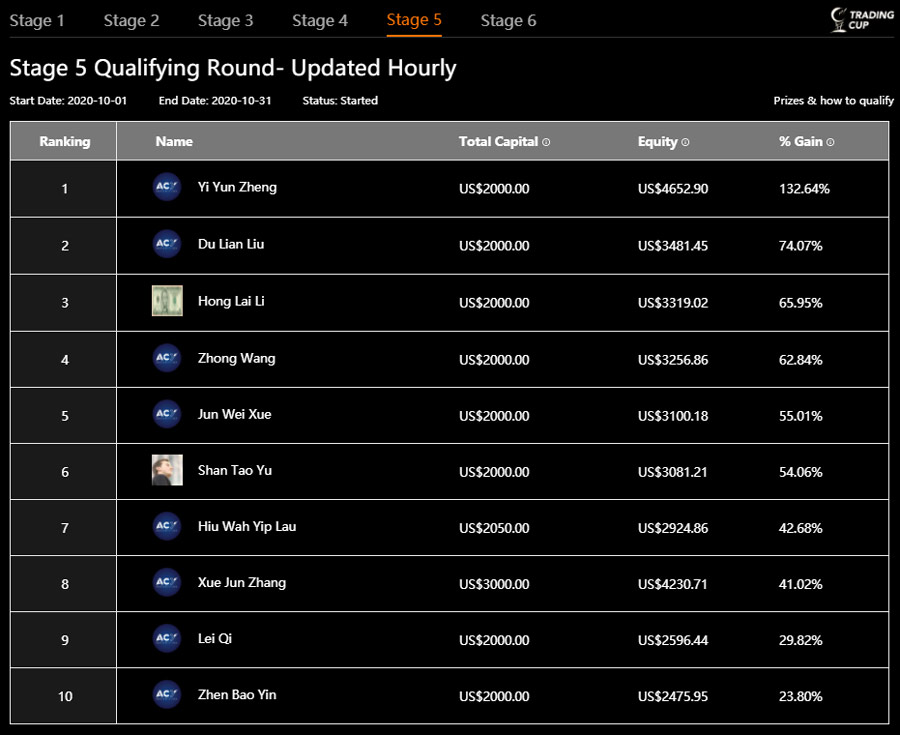
Let’s take a look at the leaderboard, as we dive deeper into the top 3 trading statistics.
As you can see, Yi Yun Zheng has continued his fine form for the whole of October, sitting atop the leaderboard with 132% in gains.
Du Lian Liu and Hong Lai Li are arguably our most consistent performers every month, so it will be an exciting finish.
A look at Yi Yun Zheng’s trading statistics
It has been an outstanding month for Yi Yun, especially given how tough the markets have been.
In particular, markets have been quite choppy, with few trending markets. This would be favouring those using more range-bound trading strategies.
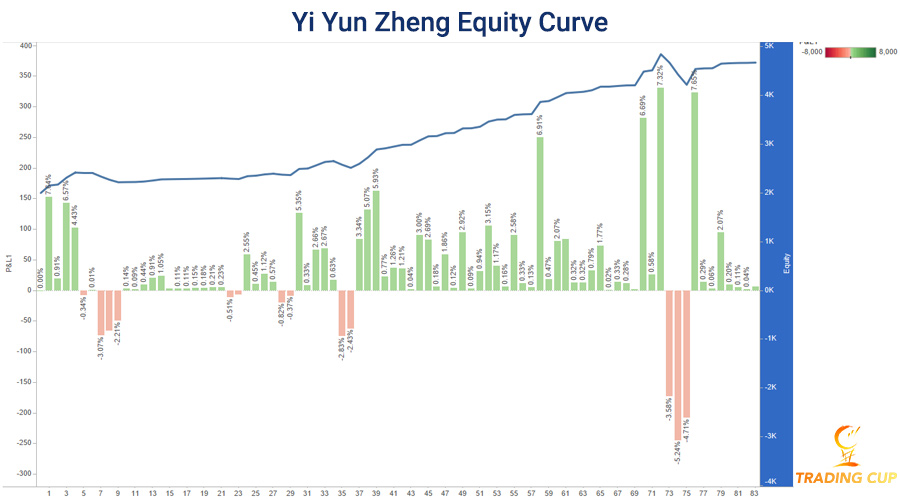
Yi Yun’s equity curve shows an abundance of winning trades, scattered with a handful of losing periods.
The most recent losing period was the biggest, but the recovery from that was swift.
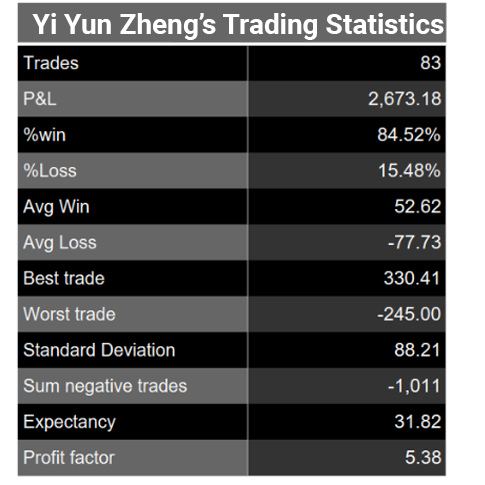
With only 83 trades on the board for October, Yi Yun could likely win the month as the most ‘efficient trader’, placing well-calculated trades at a strike rate of 84.5%.
The best trade sits at $330 versus the worst trade of $245, which bodes well for a strong month.
It appears Yi Yun can ride the momentum of many trades in a row, building a lot of confidence during a handful of periods.
Plus, it appears Yi Yun is confident in adding to winning periods when his trading strategy is on song with the market.
Du Lian Liu’s equity curve and trading statistics
Du Lian has proven month after month that he is a skillful and consistent trader. We interviewed Du Lian last month here, after his 124% monthly return.
No matter the market type, whether it be trending or range-bound, Du Lian tracks forward and locks in his gains.
Below you can see his equity curve and breakdown of all trades.
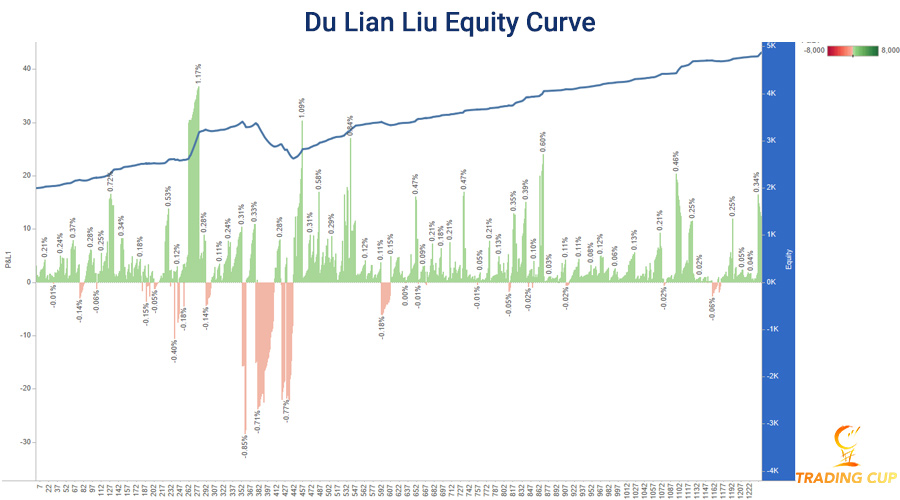
When we look at his trading stats, we can see a high win percentage, sitting at 88% across 1242 trades. That is impressive in anyone’s book.

What stands out is the size of his average win and loss, sitting at just $3.67 for a win and $7.77 for a loss.
These are ‘tight’ trading statistics, and given the high number of trades, it feels like it could be Expert Advisor related.
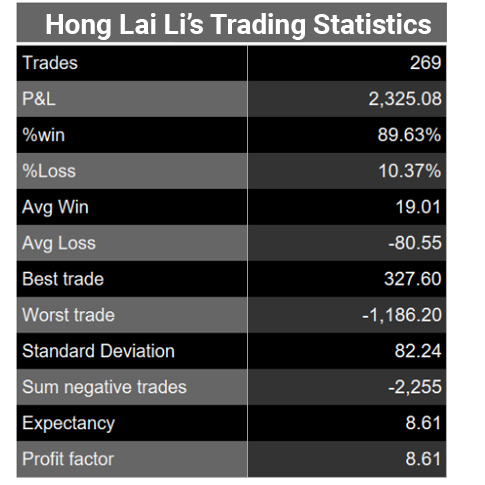
Hong Lai Liu’s trading statistics for October
Another consistent performer is Hong Lai, who we have spoken about here previously.
What is different this month about Hong Lai is that he suffered a massive pullback in his equity curve mid-month, losing $1,186 going long on Gold on the 13th of October.
You can see it marked in the equity curve below.
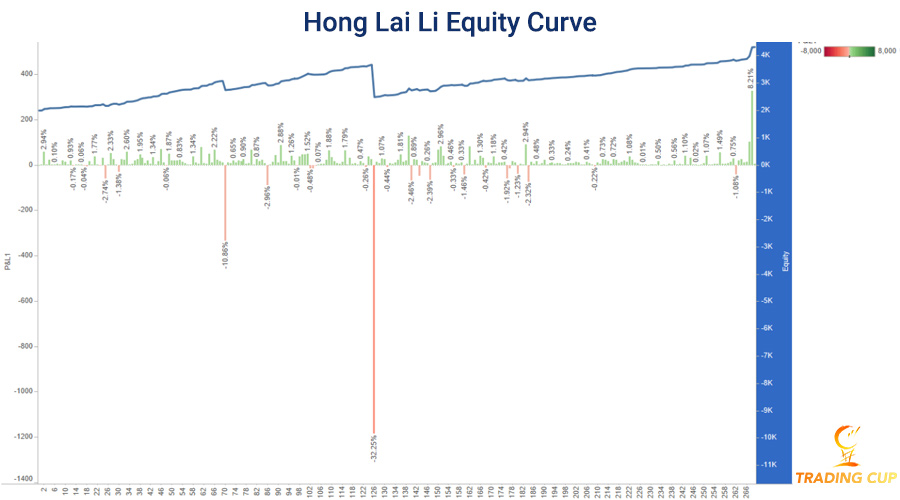
If we look at his monthly trading stats, you can see another slant towards a high percentage win rate, at 89%.
But some of the worrying stats of this system is the fact an average loss is four times larger than his average win, coupled with the massive losing trade, which is three times larger than the average win.
So there you have the top three traders as of the 30th of October.
Use their trading statistics as inspiration to create your best trading plan
The beauty of running through these trading statistics is that you get to see the real numbers behind some of the best traders we’ve seen in the competition.
You can use this to map out what elements you would like to see as part of your trading strategy.
Build it into your plan.
You can see some of the traders are more active than others, some pyramid into winning traders, and others use a combination of the two.
The key is your plan is unique to you, but you can ‘borrow’ elements that the top traders in our competition use.
Stage 5 is now open for registration
Are you ready to compete in November?
November is your final chance to qualify for the Grand Final.
This will be your last chance to compete against your fellow traders and put a line in the sand to your trading talent relative to others.
More importantly, you have the chance to mark out a dedicated 1-month trading plan, which can serve as a benchmark for future months. Map out your daily trading habits to see how you perform.
We’ve spoken about the top 20 benefits of trading competitions, mapped out a simple Gold trading strategy, and the importance of building scalable trading strategies here.
Now is the time to set your goals for November.
We look forward to seeing your name on the leaderboard.
Are you ready to join the next Stage? Click here to register an account.


Ashley Jessen is the author of CFDs Made Simple and Chief Operating Officer at ACY Securities. He has been in the financial services industry since the year 2000 and worked for some of the leading companies in the CFD, Forex and Online Trading space.