Simple Gold Trading Strategy Framework for Trending Markets
Today, we're going to look at a simple Gold trading strategy ideal for active traders.
If you have been reading the trading statistics of the winning traders, you will already know that the most actively traded instrument in the Trading Cup is Gold.
To recap:
· Stage 1 Champion Mao Long Yang – 100% of trades on Gold
· Stage 1 Second place Wen Liu – Most trades on Gold
· Stage 1 Third place Wen Bin Yang – Most trades on Gold
· Stage 2 Champion Zhen Wang – 100% of trades on Gold
· Stage 3 Champion Mao Long Yang – 100% of trades on Gold
· Stage 4 Leader Gui Lin Li – Most trades on Gold
Apart from the quality of the liquidity feed on Gold and the tight spreads, let's see why Gold has been such a favourite among the Champions in 2020.
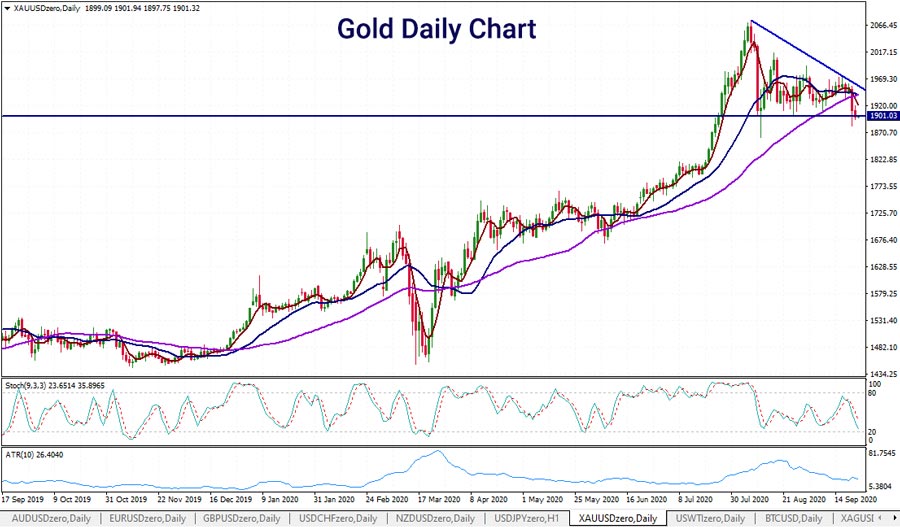
Gold has had several phases of consolidation, followed by impressive moves higher.
You will notice the rapid drop as the realisation about coronavirus hit the world, sending global markets & commodities tumbling in unison.
And with that comes increased volatility. Active traders need volatility, which is why the precious metal has been so popular in 2020.
In 2020, Gold has been as high as $2,074.89 and down as low as $1,451.24, which gives a range of $623.65 or 42.9%.
When you combine those moves with a leveraged, highly liquid trading instrument, you can see why Gold is such a key focus for active day traders in the Trading Cup contest.
The simple Gold trading strategy
The strategy we are going to have a look at today involves using three simple moving averages.
These three moving averages are:
· 5-period moving average
· 20-period moving average
· 50-period moving average
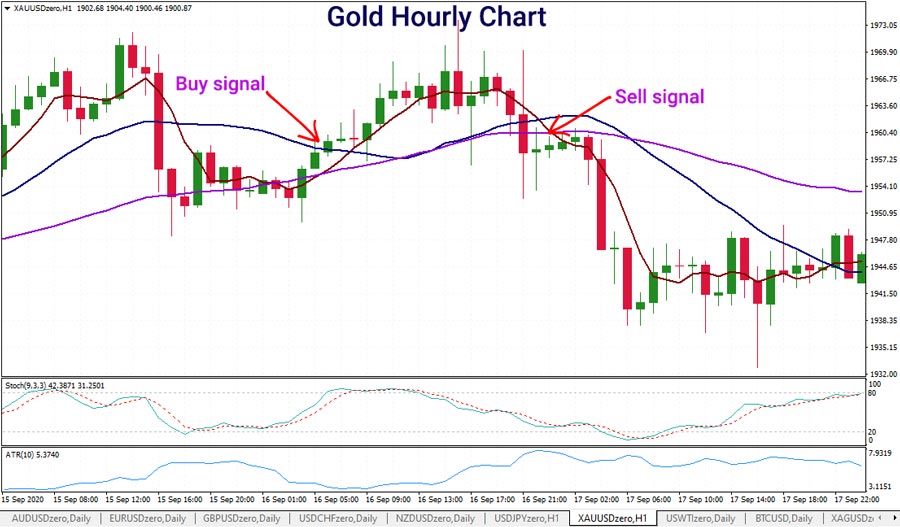
You can see the three simple moving averages below, applied on the hourly chart.
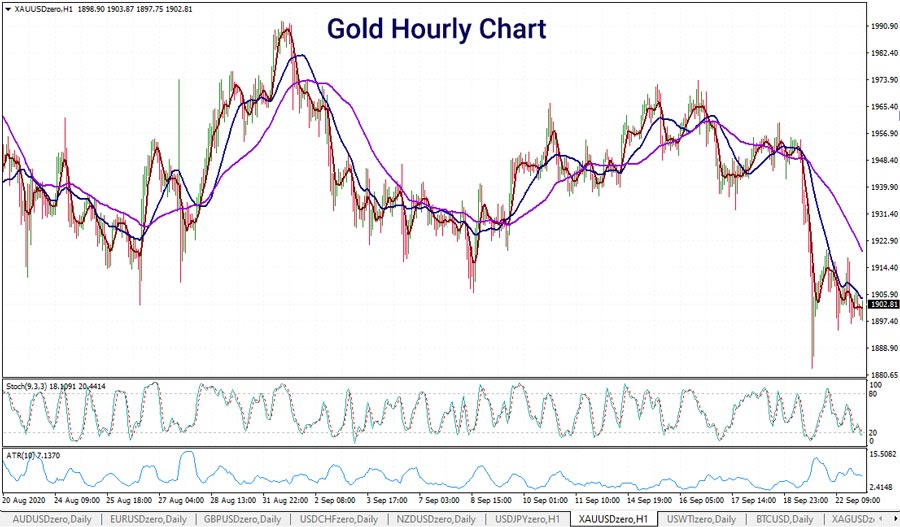
What we're going to do is move down to an hourly chart to get the frequency of signals higher.
This means you'll get more signals, and the strategy can be tested across the hourly timeframe to see if it fits in with your risk tolerance and trading timeframes.
Why are we outlining such a simple moving average strategy across Gold?
First of all, we do want you to keep in mind this is just a framework.
We suggest you use this framework as an idea generator.
What you want to do is to see if the idea fits in with your timeframe, risk tolerance, and your ability to get in and out of the market.
As you probably appreciate, we all trade with our own biases, and those biases shape the way we trade.
For some of you, when you see this strategy, it will not resonate with you, and you will not want to trade this particular strategy.
For others, it might inspire some curiosity in what you could use as part of your trading strategies, or you could look to incorporate bits and pieces of this into your methodologies.
The Three Moving Averages
The three moving averages we're going to look to use, as mentioned before, are a:
- 5-day period simple moving average;
- 20-day period simple moving average; and a
- 50-day period moving average.
Typically, a moving average crossover system would be a simple two moving average system where you might have, say, just the 5 and the 20.
But what you'll tend to find over time is you need some qualification gates that stop you from entering low probability trades.
Of course, we'd all like the highest probability trades with the lowest possible risk, but this is just a gentle way to get an understanding and, as mentioned, a framework around a methodology you can test to see if it fits in with your criteria.
What we're going to look for is we want to see the 5-period moving average rising through the 20-period moving average.
The 5-period is the maroon line. The 20-period is the blue line. The 50-period is the purple line.
We want to see the 5-period rising through the 20-period to generate a buy signal.
And to keep things very simple, we're just going to wait for the cross to occur, so when the 5-period crosses back down below the 20-period moving average that would be the exit.
Building a solid exit strategy
Of course, exits are extremely important for any trading system. Exits are when you lock in that profit or loss. So, it goes without saying, your exits are critical.
You might want to play around with more aggressive exits or more passive exits, depending on how much the market is trending.
As you can appreciate, moving averages are very slow-moving.
They are lagging indicators, so we're not going to be the first into any trend.
This particular strategy is looking to capture portions of the trend. Of course, moving averages are great if you want a low-maintenance strategy that is not actively buying and selling.
How to avoid getting chopped in and out using a moving average gate
Let's talk about the qualifying gate.
The qualifying gate is the 50-period moving average or the purple line.
What we want to do is we only want to take a long position when the 50-period moving average is rising today compared to yesterday.
Conversely, we only want to take a short position when the 50-period moving average is lower today than yesterday.
Combining the three moving averages to confirm an entry signal
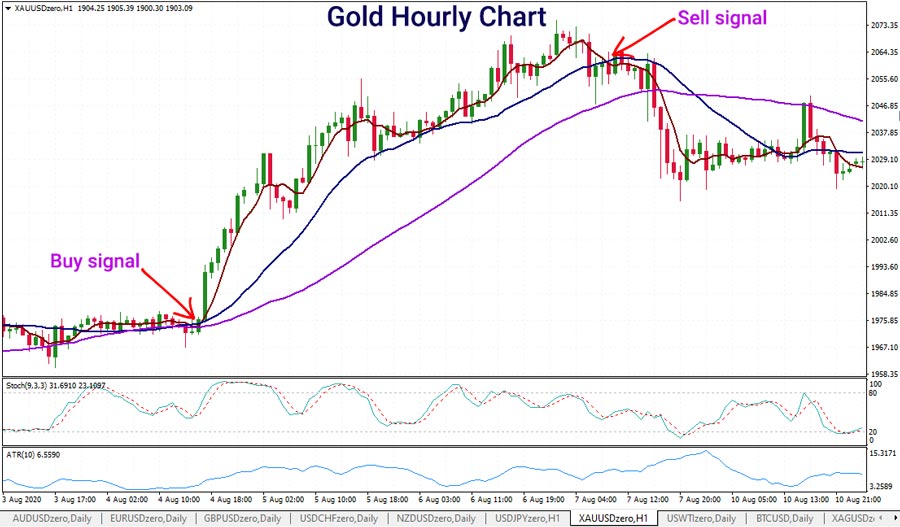
Here is what a long entry signal will look like:
- The 50-period moving average (purple line) is rising today compared to yesterday
- The 5-period moving average (brown line) has crossed the 20-period moving average (blue line)
Getting Whipsawed In and Out
By having a qualifying gate, it sits there to help us eliminate getting whipsawed in and out and going long and short.
You see, the 50-period moving average is long enough, such that if we're in a long trade, often, we won't be able to take the short trade directly after.
Typical moving average systems are 'always in' meaning you go long when the short-term moving average crosses the longer moving average and then reverse to short when the short-term moving average crosses back below the longer-term moving average.
You're either long, or you're short, and you are always in.
But by having a qualifying gate, the goal is to qualify the trades to try and eliminate those where you might get whipsawed.
Time and price
When a market rallies, you have both time and price.
If it moves quickly in price, then time has to catch up, and we usually see a consolidation period.
It's during those consolidations that moving average systems usually get you chopped in and chopped out, costing you brokerage along the way.
Example of winning and losing trades
Let's look at a winning trade example of this and how we would have locked in profits.
Then we'll look at one losing trade where we would have exited at a loss, so that you can see both sides of the story.
Always keep in mind that this is just a framework.
You can potentially use this framework or add on to an existing trading strategy you might be using or use portions of it to test to see if it's worthwhile for you to pursue as a trading system on your live account.
Winning trade example
Hypothetical entry price long: 1951.23
Hypothetical exit price: 2001.64
Total gain: $50.41 or 2.58%
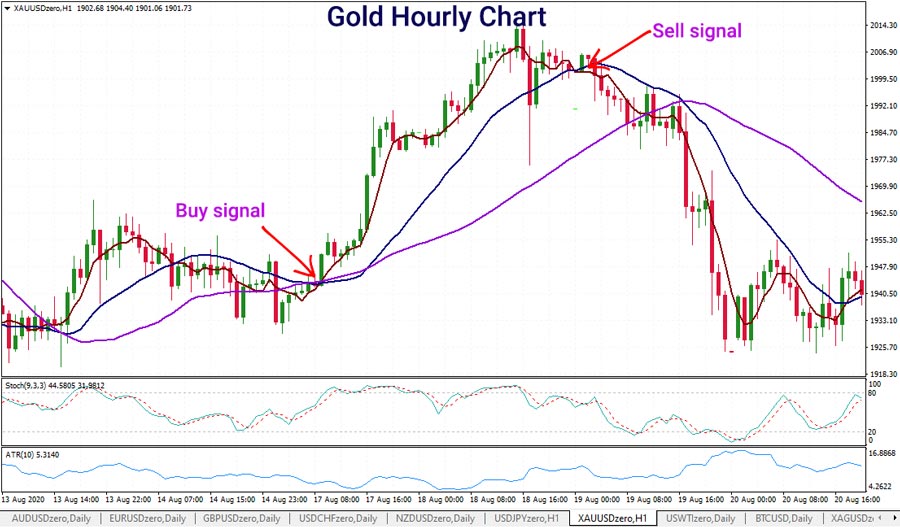
Losing trade example
Hypothetical entry price long: 1959.63
Hypothetical exit price: 1958.49
Total win: -$1.14 or -0.06%
Backtest all trading ideas before going live
One of the things we would recommend is backtesting any trading system before you commit your funds to trading it.
You can backtest the system manually, but you need to make sure you get a large enough same size. A large enough sample size when backtesting means a minimum of 200 completed trades based on the exact entry and exit criteria.
If you are ready to go live, then 20-30 trades using micro position size would give an excellent sample size to have enough wins and losses.
Alternatively, if you are good enough to code your own system test, you can test hundreds or thousands of trades in minutes.
Your goal here is to run a system test to see if this strategy is producing a positive expectancy.
By positive expectancy, we mean there's an edge in the system to give you profitability over time. Another way to look at it is that for every dollar you risk, you expect to make a small return for every dollar risked.
Remember to include sensible money management into your system
A couple of the other elements we haven't talked about regarding this system is your money management rules.
Of course, you want to risk a small portion of your overall funds in any one trade, so do keep that in mind, as well, and build a money management system that helps you meet your financial objectives.
As you can see, the system itself is designed to capture the trend on an hourly chart, trading gold, and when it does trend, it enables you to lock in some good profits.
However, when it does get you out of the market, and you have a loss on the trade, those losses aren't too severe.
Be sure to test these strategies on a demo account or paper trading before you go live.
Another money management principle we've spoken about extensively on this blog is pyramiding. As this is a trend based trading idea, you may want to look into pyramiding as a way to add to winning positions.
Click here to find out more about pyramiding into winning trades and who Zhen Wang used this position sizing method to generate over 3,400% in one month in Stage 2.

Are you ready to join the next Stage? Click here to register an account.

Ashley Jessen is the author of CFDs Made Simple and Chief Operating Officer at ACY Securities. He has been in the financial services industry since the year 2000 and worked for some of the leading companies in the CFD, Forex and Online Trading space.